
Python
April 11, 2021Cartesian Product, Permutations
https://www.geeksforgeeks.org/python-construct-cartesian-product-tuple-list/
example: get all permutations of coords x,y,z for {0,1,2} +- 1
res = [(x, y, z) for x in range(-1,1) for y in range(0,2) for z in range(1,3)]
print(res)
Neighbors
minX = max(0, x - 1)
maxX = min(len(line) - 1, x + 1)
minY = max(0, y - 1)
maxY = min(len(lines) - 1, y + 1)
neighbors = [
    (x, y) for x in range(minX, maxX) for y in range(minY, maxY)
]
get the min/max of coords (tuple)
all_vals = list(graph.weights.keys()) + [graph.start_pos, graph.end_pos]
xs = list(map(lambda val: val[0], all_vals))
ys = list(map(lambda val: val[1], all_vals))
min_xy = (min(xs), min(ys))
max_xy = (max(xs), max(ys))
Manhattan Distance
https://docs.scipy.org/doc/scipy/tutorial/index.html
from scipy.spatial import distance
distance.cityblock([1, 0, 0], [0, 1, 0]) # 2

def manhattan_distance(a: GridLocation, b: GridLocation) -> int:
    return sum(abs(point1 - point2) for point1, point2 in zip(a, b))

manhattan_distance((2,18),(-2, 15)) # 7
Umeyama algorithm
https://zpl.fi/aligning-point-patterns-with-kabsch-umeyama-algorithm/
def kabsch_umeyama(A, B):
    assert A.shape == B.shape
    n, m = A.shape

    EA = np.mean(A, axis=0)
    EB = np.mean(B, axis=0)
    VarA = np.mean(np.linalg.norm(A - EA, axis=1) ** 2)

    H = ((A - EA).T @ (B - EB)) / n
    U, D, VT = np.linalg.svd(H)
    d = np.sign(np.linalg.det(U) * np.linalg.det(VT))
    S = np.diag([1] * (m - 1) + [d])

    R = U @ S @ VT
    c = VarA / np.trace(np.diag(D) @ S)
    t = EA - c * R @ EB

    return R, c, t

A = np.array([[ 23, 178],
              [ 66, 173],
              [ 88, 187],
              [119, 202],
              [122, 229],
              [170, 232],
              [179, 199]])
B = np.array([[232, 38],
              [208, 32],
              [181, 31],
              [155, 45],
              [142, 33],
              [121, 59],
              [139, 69]])

R, c, t = kabsch_umeyama(A, B)
# R = [[-0.81034281,  0.58595608]
#      [-0.58595608, -0.81034281]]
# c = 1.46166131
# t = [271.3345951, 396.07800317]

B = np.array([t + c * R @ b for b in B])
# B = [[ 29.08878779, 152.36814188]
#      [ 52.37669337, 180.03008629]
#      [ 83.50028582, 204.33920503]
#      [126.28647155, 210.02515345]
#      [131.40664707, 235.37261559]
#      [178.54823113, 222.56285654]
#      [165.79288328, 195.30194121]]
Linear Algebra, Machine Learning
NumPy
https://numpy.org/doc/stable/user/absolute_beginners.html - getting started
https://www.educba.com/matrix-multiplication-in-numpy/ - detailed explanations of functions
https://www.tutorialexample.com/understand-numpy-np-multiply-np-dot-and-operation-a-beginner-guide-numpy-tutorial/ - explains diff between dot, multiply and *
Raycasting
Find whether a point is inside or outside a polygon. Odd number of inversions is inside, even is outside.
http://philliplemons.com/posts/ray-casting-algorithm
# http://philliplemons.com/posts/ray-casting-algorithm
# https://www.youtube.com/watch?v=zhmzPQwgPg0
# has edge cases
def count_inversions(visited: set[Coord], line: str, x: int, y: int) -> int:
    count = 0
    for idx in range(x):
        if not (idx, y) in visited:
            continue

        count += line[idx] in {CharMap.PIPE.value, CharMap.EL.value, CharMap.JAY.value}

    return count
Finding Cycles
Endless/large loops can be shortcut by finding 'cycles' or repeating patterns and using math.
example with offset (pattern starts after offset)
set is used to speed up lookups, tuple is required to use it. (https://www.youtube.com/watch?v=WCVOBKUNc38)
def part_2(data: InputData) -> int:
    data = tuple(data)
    seen = {data}
    cycles = [data]

    iteration = 0
    while True:
        iteration += 1
        data = spin_cycle(data)
        if data in seen:
            break

        seen.add(data)
        cycles.append(data)

    first = cycles.index(data)
    cycle_grid_index = (1000000000 - first) % (iteration - first) + first
    data = cycles[cycle_grid_index]

    return calculate_load(list(data))
rotating lists
https://github.com/terminalmage/adventofcode/blob/main/2022/day20.py
Take a list of numbers and move the original values + or - the amount of the value.
from random import randrange
from collections import deque

data = [x * randrange(-10, 10) for x in range(10)]
# [0, 9, -12, -21, 16, 10, -36, -56, -16, 27]

original_order = list(enumerate(int(x) * 1 for x in data))
# [(0, 0), (1, 9), (2, -12), (3, -21), (4, 16), (5, 10), (6, -36), (7, -56), (8, -16), (9, 27)]
sorted_list = deque(original_order, maxlen=len(data))
for val in original_order:
    # Rotate until we get to the location of this value
    sorted_list.rotate(-sorted_list.index(val))
    # deque([(0, 0), (1, 9), (2, -12), (3, -21), (4, 16), (5, 10), (6, -36), (7, -56), (8, -16), (9, 27)], maxlen=10)

    # Pop the value off the list, and then rotate again by that
    # amount to point the front of the queue at the location where
    # we need to move it
    sorted_list.rotate(-sorted_list.popleft()[1])
    # deque([(1, 9), (2, -12), (3, -21), (4, 16), (5, 10), (6, -36), (7, -56), (8, -16), (9, 27)], maxlen=10)

    # Place the the value in its new location
    sorted_list.appendleft(val)
    # deque([(0, 0), (1, 9), (2, -12), (3, -21), (4, 16), (5, 10), (6, -36), (7, -56), (8, -16), (9, 27)], maxlen=10)

# deque([(9, 27), (4, 16), (0, 0), (1, 9), (7, -56), (6, -36), (5, 10), (2, -12), (3, -21), (8, -16)], maxlen=10)
Graphs
Practical Graph Theory using Networkx
Cuts
Identify the x(3) places to cut and split graphs.
- https://networkx.org/documentation/stable/reference/algorithms/cuts.html
- https://en.wikipedia.org/wiki/Cut_%28graph_theory%29
Visualizing
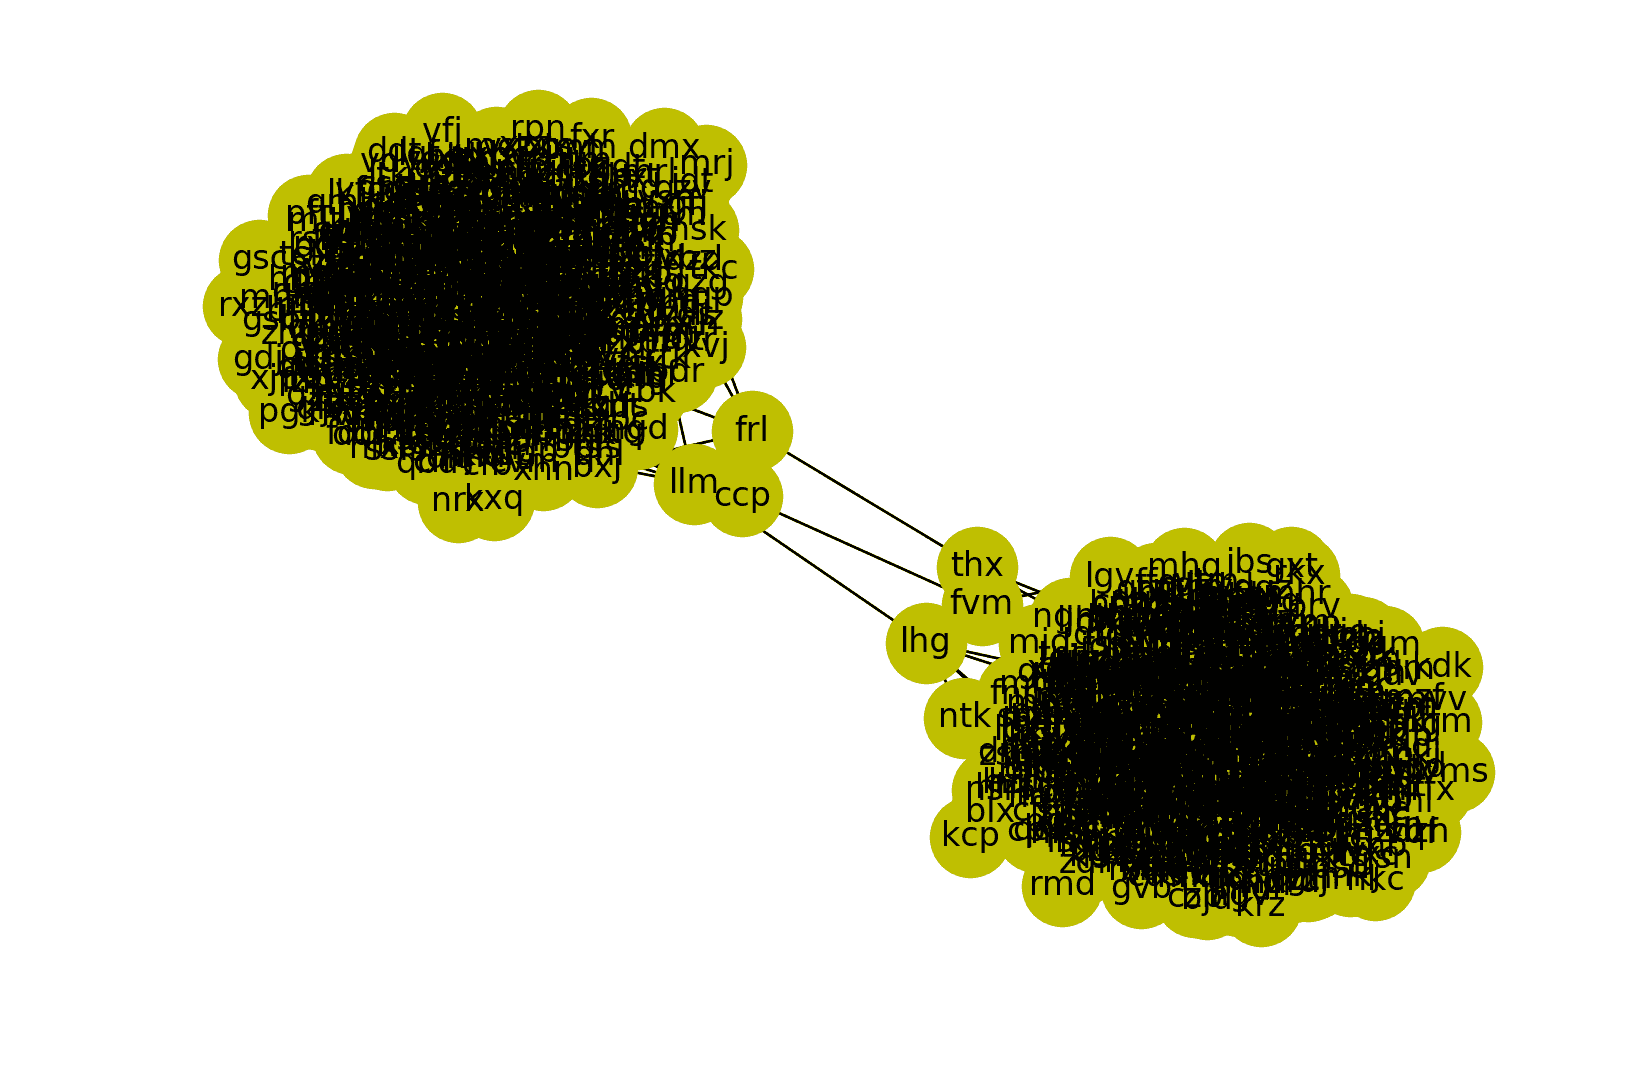
Cutting fri -- thx, ccp -- fvm, and llm -- lhg would create two separate graphs.
import networkx as nx
import matplotlib.pyplot as plt
import numpy as np

InputData = dict[str, set[str]]

data = {'jqt': {'nvd', 'ntq', 'xhk', 'rhn'}, 'nvd': {'jqt', 'pzl', 'cmg', 'lhk', 'qnr'}, 'xhk': {'jqt', 'rhn', 'bvb', 'ntq', 'hfx'}, 'rhn': {'bvb', 'jqt', 'hfx', 'xhk'}, 'rsh': {'frs', 'rzs', 'lsr', 'pzl'}, 'frs': {'lhk', 'qnr', 'lsr', 'rsh'}, 'lsr': {'rzs', 'pzl', 'rsh', 'frs', 'lhk'}, 'pzl': {'nvd', 'hfx', 'lsr', 'rsh'}, 'hfx': {'pzl', 'rhn', 'bvb', 'ntq', 'xhk'}, 'cmg': {'rzs', 'nvd', 'bvb', 'lhk', 'qnr'}, 'lhk': {'nvd', 'frs', 'cmg', 'lsr'}, 'bvb': {'rhn', 'cmg', 'ntq', 'hfx', 'xhk'}, 'qnr': {'nvd', 'frs', 'rzs', 'cmg'}, 'ntq': {'bvb', 'jqt', 'hfx', 'xhk'}, 'rzs': {'lsr', 'cmg', 'qnr', 'rsh'}}

vertices = []
edges = []

for k, vals in data.items():
    vertices.append(k)
    for v in vals:
        edges.append((k, v))

G = nx.Graph()
G.add_nodes_from(vertices)
G.add_edges_from(edges)
plt.subplot()
nx.draw(G, with_labels=True, node_color="y", node_size=800)

cuts = nx.minimum_edge_cut(G)
for cut in cuts:
    G.remove_edge(*cut)

# print(max(nx.connected_components(G), key=len))
subgraphs = [G.subgraph(c).copy() for c in nx.connected_components(G)]
counts = [len(s) for s in subgraphs]